Chart of the Day: See what tourists spent on in 2017
Tourist shoppers spent $4.73b on shopping from Q1 to Q3.
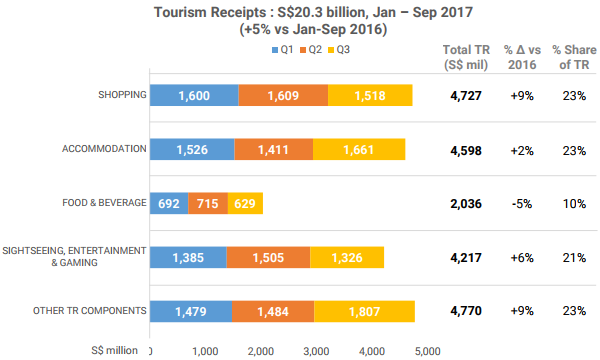
This chart from the Singapore Tourism Board (STB) shows that in Q1 to Q3, shopping took up 23% or $4.73b of tourists' expenses whilst in the city state.
Spending was highest in Q2, when shopping receipts hit $1.61b.
Other tourism receipt components took the same share of spending at 23% and had a value of $4.77b. Spending was highest in Q3 at $1.81b.
Accommodation also ate up 23% or $4.6b of tourists' expenses. Visitors spent less in Q2 with $1.41b and spent the highest in Q3 with $1.66b.
Tourists made sure to have fun whilst in the city state as total spending for Sightseeing, Entertainment & Gaming (TRexSEG) grew 6% to $4.22b. The thrill was highest in Q2 as visitors spent $1.51b on the segment.
Meanwhile, spending on food and beverage dampened by 5% within the three quarters. Q3 was the weakest quarter as receipt totals hit only $629m, compared to $692m in Q1 and $715m in Q2.


 Advertise