Chart of the Day: Here's how Singaporeans spend their income
Rising incomes afforded them to spend more money for travels abroad.
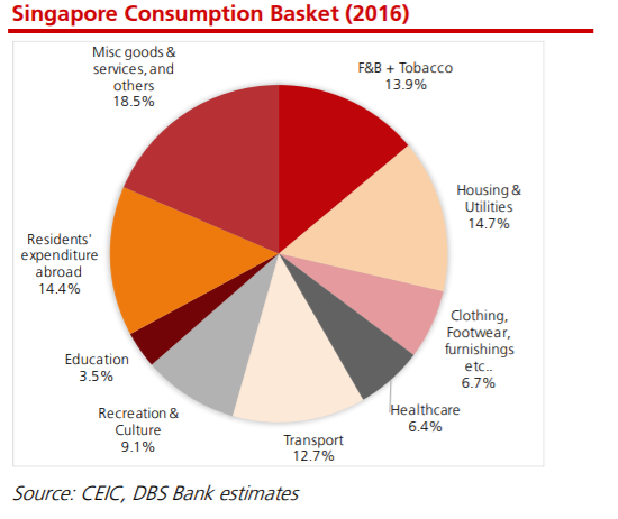
This chart from DBS shows that the largest chunk of Singaporean’s household income in 2016 goes to housing and utility fees (14.7%), whilst the second largest chunk goes for expenses in their travels abroad (14.4%).
DBS noted that they are also spending more on healthcare (6.4%) and education (3.5%) than they did in the 2000s where they spent only 3.2% and 0.0% of their household income for the same sectors.
The chart also showed that spending on basic necessities including F&B (13.9%), clothing and furnishing (6.7%), took up significantly less proportion of Singaporeans’ income.
DBS said that the significant change in how people spend has led household expenditure spendings’ contribution to GDP sink to 34.3% in 2016 from 45.5% in 1985 as the rising GDP per capita which tripled to US$52,601 from US$16,337 three decades ago led Singaporeans to spend more of their income to travel abroad.
“We expect these trends to broadly continue into 2030, and for spending on travel abroad to account for 14.8% of household expenditure, healthcare to comprise 7.7%, education to comprise 4.4% and recreation and culture to comprise 9.5%,” DBS said.
The bank believes that three key factors could likely drive Singaporeans’ consumption patterns which include growing incomes, declining work hours which leaves them to have more time for travel and leisure, and the ageing population in Singapore.


 Advertise


