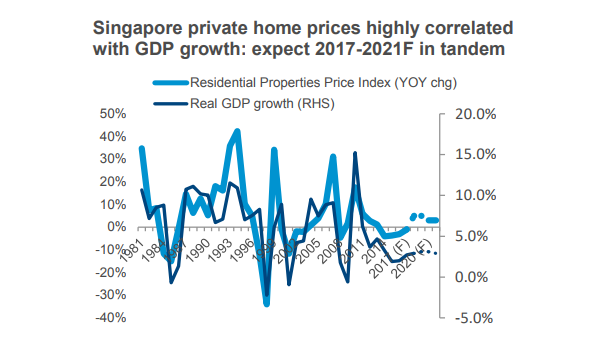
Chart of the Day: Singapore's home prices fell with slow GDP growth
The two have shown a history of correlation.
This chart from Colliers International shows overall private home prices have fallen by 11.6% over 15 quarters from 3Q2013 to 2Q2017 when GDP growth was modest at 1.9% to 2.0%.
This was also coupled with loan curbs and stringent taxes such as the ABSD and the SSD and the peak supply of 18,971 to 20,803 annual private home completion in 2014 to 2016.
Historically, Singapore's private home prices have a strong correlation with GDP growth.
During the dotcom bust in 2001, private home prices fell 11.7%. They also jumped 31.1% in 2007, reflecting the global economic boom, population influx, and housing undersupply.
Colliers projects private home prices could rise in tandem with higher GDP growth expectations of 2.7% in 2017 and 2.9% in 2018.
"With property cooling measures still in place, and all else constant, we are unlikely to see volatile price swings," the firm said.


 Advertise


